Sally Larsen

Part two: NAPLAN Results Haven’t Collapsed – But Media Interpretations Have

This is the second instalment of our two-part series addressing claims made about NAPLAN data. The first part is here

We begin this section by addressing a comment made in ABC media reporting on 2025 NAPLAN results.

“We’ve seen declines in student achievement despite significant investment in funding of the school system”

This comment echoes a broader theme that re-surfaces regularly in public discussions of student achievement on standardised tests. There are two aspects of this comment to unpack and we address each in turn. 

No evidence

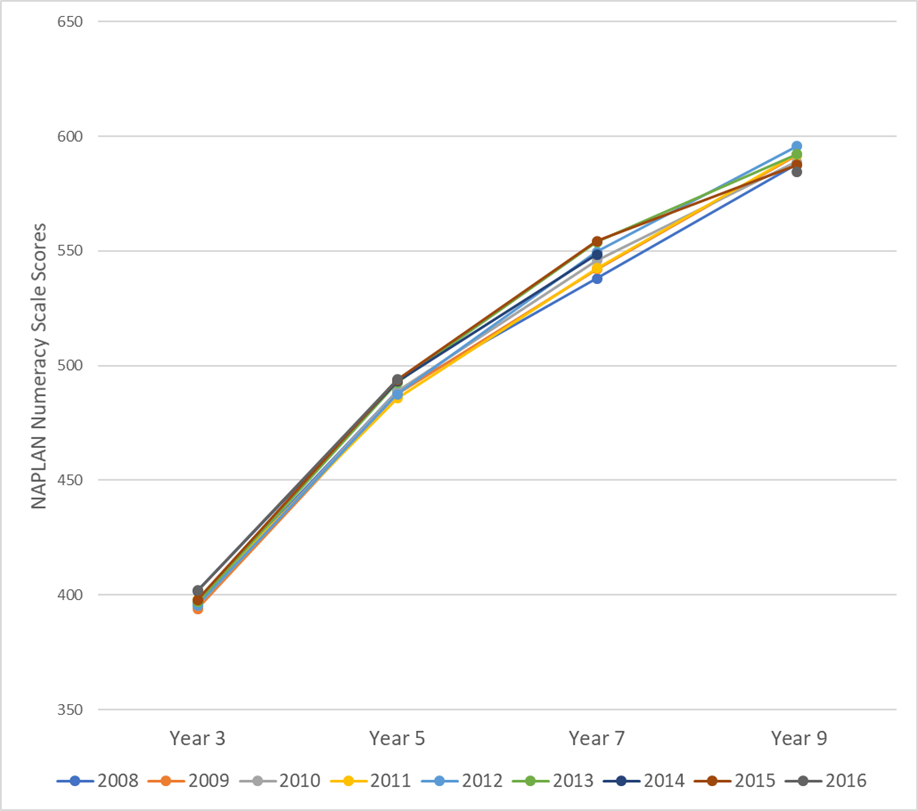
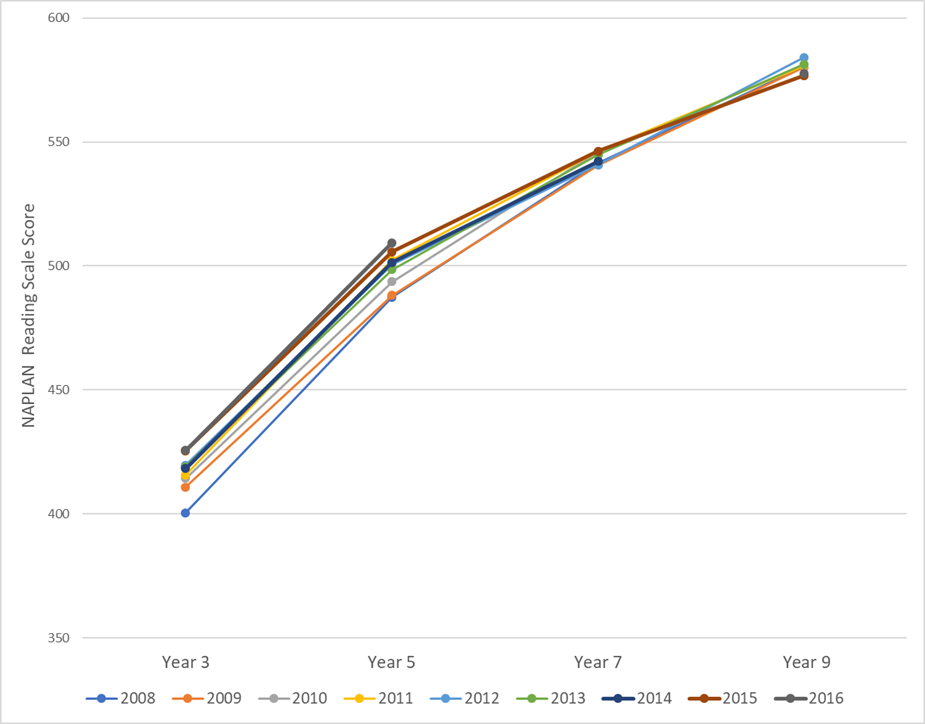
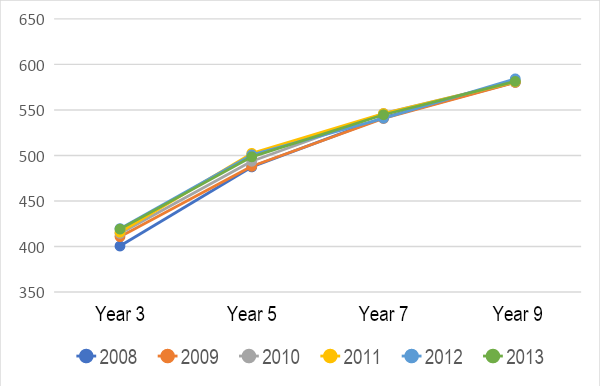
First the concept that student achievement is declining is demonstrably untrue if we evaluate NAPLAN data alone. There is no evidence that student achievement in NAPLAN declined between 2008 and 2022 – and indeed there were some notable gains for Year 3 and Year 5 students in several domains. Results from 2023 to 2025 have remained stable across all Years and all domains. 

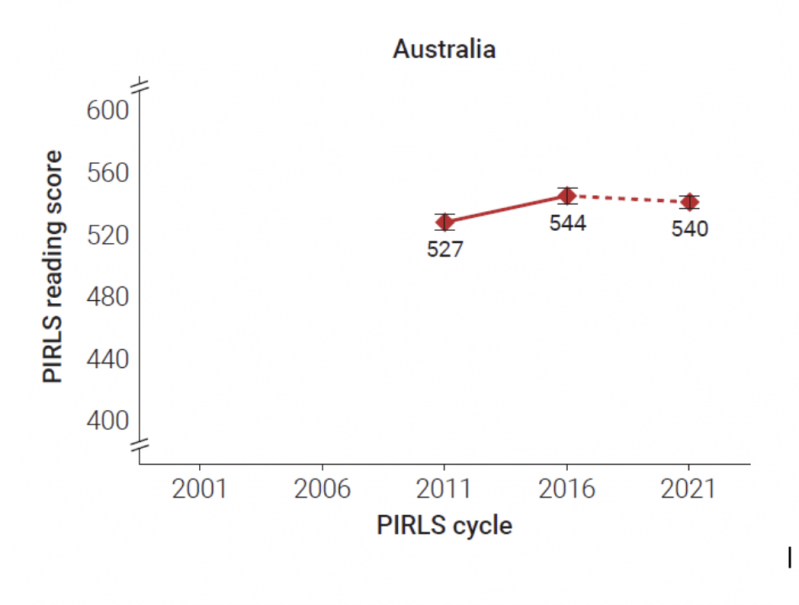
By contrast, there have been well-documented declines in average achievement in the Reading, Mathematics and Scientific Literacy tests implemented by the Programme for International Student Assessment (PISA). PISA tests are undertaken by Australian 15-year-old students every three years. The most recent data, from the 2022 assessment round showed that these declines had flattened out in all three test domains since the 2015 round: in other words the average decline has not continued after 2015. 

There’s plenty of speculation as to why there have been declines in PISA test scores specifically, and there are enough plausible explanations to suggest that no single change in schools, curriculum, pedagogy or funding will reverse this trend. Nonetheless it is important to highlight the contrast between PISA and NAPLAN and not conflate the two in public discussion about student performance on standardised tests.

Before Gonski, schools were relatively underfunded

The second aspect of the claim above is that increases in school funding should have resulted in improvements in NAPLAN achievement (notwithstanding the fact that average results are not trending downwards). School funding has increased since the publication of the first Gonski report in 2011, and subsequent government efforts to adequately fund schools as per the model agreed upon. This is one reason why the total amount of money spent on schooling has increased in the last 10-15 years: because prior to Gonski, government schools were relatively underfunded across the board (and many remain so).

A second reason relates to government policies resulting in more children staying in school for longer (arguably a good thing). The 2009 National Report on Schooling in Australia (ACARA, 2009) produced a handy table identifying new state and territory policies aimed at increasing the proportions of students engaged with education, training or employment after the age of 15 (p. 36). For example, in NSW (the largest jurisdiction by student numbers), the new policy from 2010 was as follows:

“(a) From 2010 all NSW students must complete Year 10. After Year 10, students must be in school, in approved education or training, in full-time employment or in a combination of training and employment until they turn 17.”

Students stay at school longer

This and similar policies across all states and territories had the effect of retaining more students in school for longer, therefore costing more money.  

The other reason total school funding has increased is simple: growth in total student numbers. If there are more students in the school system, then schools will cost more to operate.

According to enrolment statistics published on the ACARA website, from 2006 to 2024, the number of children aged 6 – 15 enrolled in schools increased from 2,720,866 to 3,260,497. This represents a total increase of 539,631 students, or a 20% increase on 2006 numbers. These gains in total student numbers were gradual but consistent year on year. It is a pretty simple calculation to work out: more students = higher cost to schools.

Students who ‘start behind, stay behind’

The design of the NAPLAN tests allow an excellent opportunity to test claims that children who start with poor achievement never ‘catch up’. Interestingly, the Australian Education Research Organisation published a report in 2023 that calls into question this idea. The AERO report demonstrated that of all the children at or below the National Minimum Standard (NMS) in Year 3 (187, 814 students in their national sample), only 33-37% remained at or below NMS to Year 9. 

We can explain this another way using the terminology from the new NAPLAN proficiency standards. Of the ~10% of students highlighted as needing additional support, it is likely that one third of these students will need that additional support throughout their schooling – or around 3.5% of the total population. The remainder of the students needing additional support in Year 3 in fact did make additional gains and moved up the achievement bands as they progressed from Year 3 to Year 9.

AERO’s analyses supported other research that had used different methods to analyse longitudinally matched NAPLAN data. This research also showed no evidence that students starting at the bottom of  NAPLAN distributions in Year 3 fell further behind. In fact, on average, students starting with the poorest achievement made the most progress to Year 9.

Sweeping inaccurate claims

Consistently supporting students who need additional help throughout their school years is something that teachers do and will continue to do as part of their core business. Making sweeping claims that are not supported by the available data is problematic and doesn’t ultimately support schools and teachers to do their jobs well. 

In recent weeks, there have been some excellent and thoughtful pieces calling for a more careful interpretation of NAPLAN data, for example here and here. It is disappointing to see the same claims recycled in the media year after year, when published, peer-reviewed research and sophisticated data analyses don’t support the conclusions. 

Sally Larsen is a senior lecturer in Education at the University of New England. She researches reading and maths development across the primary and early secondary school years in Australia, interrogating NAPLAN. Thom Marchbank is deputy principal academic at International Grammar School, Sydney and a PhD candidate at UNE supervised by Sally Larsen and William Coventry. His research focuses on academic achievement and growth using quantitative methods for understanding patterns of student progress.

NAPLAN Results Haven’t Collapsed – But Media Interpretations Have

Each year, the release of NAPLAN results is accompanied by headlines that sound the alarm – about policy failures, teacher training and classroom shortcomings, and further and further slides in student achievement. 

In this two-part series, we address four claims that have made the rounds of media outlets over the last couple of weeks. We show how each is, at best, a simplification of NAPLAN achievement data, and that different interpretations (not different numbers) can easily lead to different conclusions. 

Are a third of students really failing to meet benchmarks?

Claims that “one-third of students are failing to meet benchmarks” have dominated recent NAPLAN commentary in The Guardian, the ABC, and The Sydney Morning Herald. While such headlines generate clicks, fuel public concern and make for political soundbites, they rest on a shallow and statistically naive reading of how achievement is reported.

The root of the problem is a change in how a continuous distribution is cut up. 

In 2023, ACARA shifted NAPLAN reporting from a 10-band framework to a new four-level “proficiency standard” model, in conjunction with the test moving online to an adaptive framework, rather than paper-based tests. 

Under the older system, students meeting the National Minimum Standard (NMS) were in Band 2 or above in Year 3, Band 4 or above in Year 5, and Band 6 or above in Year 7 and 9. Those students were not “failing”; rather, they were on the lower end of a normative distribution. Now, with fewer reporting categories (just four instead of ten), the same distribution of achievement is compressed. Statistically, when you collapse a scale with many levels into one with fewer, more students will cluster below the top thresholds; but that doesn’t mean their achievement has declined.

A particular target

Take, for example, the 2022 Year 9 Writing results. This was a particular target for media commentary this year and last.

That year, about one in seven (14.3%) of students were in Band 5 or below the National Minimum Standard. In 2025, by contrast, 40.2% of students were in the categories “Needs additional support” and “Developing”, which are the new categories for perceived shortfall. 

This represents a nearly threefold jump. But that’s only if the categories of ‘below NMS’ and within the ‘bottom two proficiency groupings’ are considered qualitatively equivalent. That’s a naive interpretation.

But let’s look at how those two groups actually scored.

In 2022, the NMS for Writing in Year 9 was Band 6, i.e., a NAPLAN score of  ≥430.8 (and Band 7 started at ~534.9), whereas in 2025, the “Developing”/“Strong” boundary is at 553, which is above the 2022 Band 6 cut-off (~485), and roughly equivalent to midway through 2022’s Band 7. 

This means that what was previously considered solid performance (Band 6 or low Band 7) is now seen as “Developing”, not “Strong.” The “Strong” range (553–646), by contrast, corresponds roughly to upper Band 7 and most of Band 8 from the 2022 scale, and the “Exceeding” range (647+) overlaps mostly with Band 9+. Students now have to reach what was previously considered top‑quartile performance to be classified as “Strong” or higher. A student scoring 500 in Year 9 Writing was in Band 6 in 2022 – above the NMS – but now falls just short of “Strong” (cut = 553). That same student would now be labelled as “Developing,” even if their skills haven’t changed.

The boundaries have changed

The results are the same. It’s the boundaries which have changed.

What’s also missing in the new scheme is the ability to compare between year levels. The historical bands allowed a direct vertical comparison across year levels; you could say a Year 3 student in Band 6 was at the same proficiency as a Year 5 student in Band 6. Proficiency categories, in comparison, are year-specific labels. “Strong” in Year 3 is not the same raw proficiency as “Strong” in Year 9; it’s the same relative standing within year expectations. 

Vertical comparison is still possible with the raw scale scores, but not with the categories. This shift makes the categories more communicative for parents (“Your child is Strong for Year 5”), but less useful for direct cross-year growth statements without going back to the underlying scale.

Surprisingly, there has been commentary that suggests that we should expect 90% of students to be scoring in the top two bands – “Strong” and “Exceeding”. 

How would that work?

Population distributions always contain variability around their mean, and the achievement distributions year to year for NAPLAN are generally consistent and similar. Expecting 90% of students to be in the top two categories, therefore, is statistically unrealistic, especially when those categories represent higher-order competencies. 

As we saw earlier, the “Strong” range (553–646) corresponds roughly to an upper Band 7 and most of Band 8 from the 2022 scale, and the “Exceeding” range (647+) overlaps mostly with 2022’s Band 9+. Students now have to reach what was previously considered top‑quartile performance to be classified as “Strong” or higher. This is a very exacting target. 

The bell curve

Most assessment distributions are approximately normal (shaped like a “bell curve”), so high achievement on the NAPLAN scale naturally includes fewer students, just as low achievement bands do. Without an intensive increase in needs-based resourcing that might change things such as class sizes and teacher to student ratios, the availability of school-based materials, resources, and training, or one to one support for struggling learners, the shape of the population distribution is likely to remain disappointingly stable.

The overall message is that students haven’t suddenly lost ground in their learning; we’ve just changed the categories that we use to understand their achievement. To interpret NAPLAN data accurately, we must consider how the framework has shifted, and avoid drawing simplistic conclusions. Even more importantly, this change in reporting is not any kind of evidence of educational failure – it’s just a shift in how we describe student progress, and not what that progress is. Misrepresenting it fuels anxiety without helping schools or students.

Most Year 9 Students Do Not Write at a Year 4 Level

Another headline resurfacing with troubling regularity is the claim that “a majority of Year 9 students write at a Year 4 level”. It’s a “major crisis” in students’ writing skills, reflecting a “thirty year policy failure”. 

This is based on distortions of analysis from the Australian Educational Research Organisation that selectively focused on Persuasive Writing as a text type. Unlike media coverage, AERO’s recent report, “Writing development: What does a decade of NAPLAN data reveal?” did not conclude that Year 9 students’ writing is at “an all-time low”. Instead, the report found a slight historical decline in writing achievement, only when examining persuasive writing as a text type. 

AERO’s report is somewhat misleading, though, because it focuses only on persuasive writing, even though NAPLAN can and does assess narrative writing as well, and the two text types are considered to have equivalence from the point of view of test design. 

In fact, in publicly available NAPLAN data from the Australian Curriculum, Assessment and Reporting Authority (ACARA), and in academic analyses of this data undertaken last year, Australian students’ Writing achievement – taken as both persuasive and narrative writing – has been quite stable over time. 

Consistent for more than a decade

For example, without taking narrative writing away from persuasive writing, mean Year 9 NAPLAN Writing achievement is quite stable, with 2022 representing the strongest year of achievement since 2011:

A graph with a line going up

AI-generated content may be incorrect.

Year 9 students’ average achievement may have been consistent for more than a decade, but what about the claim that the majority of Australian Year 9s write at a Year 4 level?

For Year 5, mean writing achievement has ranged between 464 and 484 nationally between 2008 and 2022 on the NAPLAN scale. For Year 3, the mean score range for the same period was 407 to 425. With developmental growth, mean Year 4 achievement might be expected to be somewhere in the 440 to 450 range. 

However, the cut-point for the NMS for Year 9 tended to be around 484, historically. Why is this important? Because national NAPLAN reporting always supplied the proportion of students falling below the National Minimum Standard (Band 5 and below in Year 9). This tells us how many students are demonstrating lower levels of writing achievement.

Where are most year nine students?

In 2022, only 14.3% of Year 9 students were in Band 5 or below (or below a NAPLAN scale score of about 484), which was the second-best year on record since 2011, as illustrated in the figure below. Contrast that with the 65.9% of students who scored in Band 7 or above in 2022 (with a cut point of 534.9), clearly indicating most Year 9 students have writing proficiency far beyond primary levels.

When you consider that the NMS records the proportion of students falling into Band 5 and below for Year 9, 13.7% to 18.6% of students fell in this range from 2008–2022. This is quite different to “the majority”.

In Part 2 (published tomorrow) of this series we go on to address the perennial claim that students’ results are declining, the argument that additional school funding should result in ‘better’ NAPLAN results, and the idea that children who start behind will never ‘catch up’.

Sally Larsen is a senior lecturer in Education at the University of New England. She researches reading and maths development across the primary and early secondary school years in Australia, interrogating NAPLAN. Thom Marchbank is deputy principal academic at International Grammar School, Sydney and a PhD candidate at UNE supervised by Sally Larsen and William Coventry. His research focuses on academic achievement and growth using quantitative methods for understanding patterns of student progress.

NAPLAN: Where have we come from – where to from here?

With the shift to a new reporting system and the advice from ACARA that the NAPLAN measurement scale and time series have been reset, now is as good a time as any to rethink what useful insights can be gleaned from a national assessment program.

The 2023 national NAPLAN results were released last week, accompanied by more than the usual fanfare, and an overabundance of misleading news stories. Altering the NAPLAN reporting from ten bands to four proficiency levels, thereby reducing the number of categories students’ results fall into, has caused a reasonable amount of confusion amongst public commentators, and many excuses to again proclaim the demise of the Australian education system. 

Moving NAPLAN to Term 1, with all tests online (except Year 3 writing) seems to have had only minimal impact on the turnaround of results.

The delay between the assessments and the results has been a limitation to the usefulness of the data for schools since NAPLAN began. Added to this, there are compelling arguments that NAPLAN is not a good individual student assessment, shouldn’t be used as an individual diagnostic test, and is probably too far removed from classroom learning to be used as a reliable indicator of which specific teaching methods should be preferred. 

But if NAPLAN isn’t good for identifying individual students’ strengths and weaknesses, thereby informing teacher practices, what is it good for?

My view is that NAPLAN is uniquely powerful in its capacity to track population achievement patterns over time, and can provide good insights into how basic skills develop from childhood through to adolescence. However, it’s important that the methods used to analyse longitudinal data are evaluated and interrogated to ensure that conclusions drawn from these types of analyses are robust and defensible.

Australian governments are increasingly interested in students’ progress at school, rather than just their performance at any one time-point. The second Gonski review (2018) was titled Through Growth to Achievement. In a similar vein, the Alice Springs (Mparntwe) Education Declaration (2019) signed by all state, territory and federal education ministers, argued,

“Literacy and numeracy remain critical and must also be assessed to ensure learning growth is understood, tracked and further supported” (p.13, my italics)

Tracking progress over time should provide information about where students start and how fast they progress, and ideally, allow  insights into whether policy changes at the system or state level have any influence on students’ growth.

However, mandating a population assessment designed to track student growth, does not always translate to consistent information or clear policy directions – particularly when there are so many stakeholders determined to interpret NAPLAN results via their own lens.

One recent example of contradictory information arising from NAPLAN, relates to whether students who start with poor literacy and numeracy results in Year 3 fall further behind as they progress through school. This phenomenon is known as the Matthew Effect. Notwithstanding widespread perceptions that underachieving students make less progress on their literacy and numeracy over their school years compared with higher achieving students, our new research found no evidence of Matthew Effects in NAPLAN data from NSW and Victoria.

In fact, we found the opposite pattern. Students who started with the poorest NAPLAN reading comprehension and numeracy test results in Year 3 had the fastest growth to Year 9. Students who started with the highest achievement largely maintained their position but made less progress.

Our results are opposite to those of an influential Grattan Institute Report published in 2016. This report used NAPLAN data from Victoria and showed that the gap in ‘years of learning’ widened over time. Importantly, this report applied a transformation to NAPLAN data before mapping growth overall, and comparing the achievement of different groups of students.

After the data transformation the Grattan Report found,  

“Low achieving students fall ever further back. Low achievers in Year 3 are an extra year behind high achievers by Year 9. They are two years eight months behind in Year 3, and three years eight months behind by Year 9.” (p.2)

How do we reconcile this finding with our research? My conclusion is that these opposing findings are essentially due to different data analysis decisions.

Without the transformation of data applied in the Grattan Report, the variance in NAPLAN scale scores at the population level decreases between Year 3 and Year 9. This means that there’s less difference between the lowest and highest achieving students in NAPLAN scores by Year 9. Reducing variance over time can be a feature of horizontally-equated Rasch-scaled assessments – and it is a limitation of our research, noted in the paper.

There are other limitations of NAPLAN scores outlined in the Grattan Technical report. These were appropriately acknowledged in the analytic strategy of our paper and include, modelling the decelerating growth curves, accounting for problems with missing data, allowing for heterogeneity in starting point and rate of progress, modelling measurement error, and so on. The latent growth model analytic design that we used is very suited to examining research questions about development, and the type of data generated by NAPLAN assessments.

In my view, the nature of the Rasch scores generated by the NAPLAN testing process does not require a score transformation to model growth in population samples. Rasch scaled scores do not need to be transformed into ‘years of progress’ – and indeed doing so may only muddy the waters.

For example, I don’t think it makes sense to say that a child is at a Year 1 level in reading comprehension based on NAPLAN because the skills that comprise literacy are theoretically different at Year 1 compared with Year 3. We already make a pretty strong assumption with NAPLAN that the tests measure the same theoretical construct from Year 3 to Year 9. Extrapolating outside these boundaries is not something I would recommend.

Nonetheless, the key takeaway from the Grattan report, that “Low achieving students fall ever further back” (p.2) has had far reaching implications. Governments rely on this information when defining the scope of educational reviews (of which there are many), and making recommendations about such things as teacher training (which they do periodically). Indeed, the method proposed by the Grattan report was that used by a recent Productivity Commission report, which subsequently influenced several Federal government education reviews. Other researchers use the data transformation in their own research, when they could use the original scores and interpret standard deviations for group-based comparisons.

Recommendations that are so important at a policy level should really be underpinned by robustly defended data analysis choices. Unfortunately the limitations of an analytic strategy can often be lost because stakeholders want takeaway points not statistical debates. What this example shows is that data analysis decisions can (annoyingly) lead to opposing conclusions about important topics.

Where to from here

Regardless of which interpretation is closer to the reality, NAPLAN 2023 represents something of a new beginning for national assessments in Australia. The key change is that from 2023 the time series for NAPLAN will be reset. This means that schools and states technically should not be comparing this year’s results with previous years. 

The transformation to computer adaptive assessments is also now complete. Ideally this should ensure more precision in assessing the achievement of students at the both ends of the distribution – a limitation of the original paper-based tests. 

Whether the growth patterns observed in the old NAPLAN will remain in the new iteration is not clear: we’ll have to wait until 2029 to replicate our research, when the 2023 Year 3s are in Year 9.  

Sally Larsen is a Lecturer in Learning, Teaching and Inclusive Education at the University of New England. Her research is in the area of reading and maths development across the primary and early secondary school years in Australia, including investigating patterns of growth in NAPLAN assessment data. She is interested in educational measurement and quantitative methods in social and educational research. You can find her on Twitter @SallyLars_27


Confusion on PIRLS reporting – some outlets make major mistakes

The Progress in International Reading Literacy Study (PIRLS) results were released last Tuesday, generating the usual flurry of media reports. PIRLS selects a random sample of schools and students around Australia, and assesses the reading comprehension of Year 4 students. The sampling strategy ensures that the results are as representative of the Australian population of Year 4 students as they can be. 

These latest results were those from the round of testing that took place in 2021 amid the considerable disruptions to schooling that came with the COVID-19 pandemic. Indeed, the official report released by the team at ACER acknowledged the impacts on schools, teachers and students, especially given that PIRLS was undertaken in the second half of the 2021 school year – a period with the longest interruptions to face-to-face schooling in the two largest states (NSW and Victoria). 

Notwithstanding these disruptions, the PIRLS results showed no decline in the average score for Australian students since the previous testing round (2016), maintaining the average increase from the first PIRLS round Australia participated in (2011). The chart below shows the figure from the ACER report (Hillman et al., 2023, p.22).

The y-axis on this chart is centred at the historical mean (a score of 500) and spans one standard deviation above and below the mean on the PIRLS scale (1SD = 100). The dashed line between 2016 and 2021 is explained in the report: 

“Due to differences in the timing of the PIRLS 2021 assessment and the potential impact of COVID-19 and school closures on the results for PIRLS 2021, the lines between the 2016 and 2021 cycles are dashed.” (Hillman et al., 2023, p.22).

Despite these results, and the balanced reporting of the ACER official report, reiterated in their media release and piece in The Conversation, the major newspapers around Australia still found something negative to write about. Indeed, initial reporting collectively reiterated a common theme of large-scale educational decline. 

The Sydney Morning Herald ran with the headline: ‘Falling through the cracks’: NSW boys fail to keep up with girls in reading. While it’s true to say the average difference between girls and boys has increased since 2011 (from 14 scale scores to 25 in 2021), boys in NSW are by no means the worst performing group. Girls’ and boys’ average reading scores mirror a general trend in PIRLS: that is, improvement from 2011 and pretty consistent thereafter (see Figure 2.11 from the PIRLS report below). Observed gender gaps in standardised tests are a persistent, and as yet unresolved, problem – one that researchers and teachers the world over have been considering for decades. The words ‘falling through the cracks’ implies that no one is looking out for boys’ reading achievement, an idea that couldn’t be further from the truth. 

Similarly, and under the dramatic headline, Nine-year-olds’ literacy at standstill, The Australian Financial Review also ran with the gender-difference story, but at least indicated that there was no marked change since 2016. The Age took a slightly different tack, proclaiming, Victorian results slip as other states hold steady, notwithstanding that a) the Victorian average was the second highest nationally after the ACT, and b) Victorian students had by far the longest time in lockdown and remote learning during 2021. 

Perhaps the most egregious reporting came from The Australian. The story claimed that the PIRLS results showed “twice as many children floundered at the lowest level of reading, compared with the previous test in 2016 … with 14 per cent ranked as ‘below low’ and 6 per cent as ‘low’”. These alarming results were accompanied by a graph showing the ‘below low’ proportion in a dangerous red. The problem here is that whoever has created the graph has got the numbers wrong. The article has reversed the proportions of students in the two lowest categories. 

A quick check of the official ACER report shows how they’ve got it wrong. The figure below shows percentages of Australian students at each of the five benchmarks in the 2021 round of tests (top panel) and the 2016 round (bottom panel), taken directly from the respective year’s reports. The proportions in the bottom two categories – and indeed all the categories – have remained stable over the five-year span. This is pretty remarkable considering the disruption to face-to-face schooling that many Year 4 children would have experienced during 2021.

But, apart from the unforgivable lack of attention to detail, why is this poor reporting a problem? Surely everyone knows that news articles must have an angle, and that disaster stories sell? 

The key problem, I think, is the reach of these stories relative to that of the official reporting released by ACER, and by implication, the impact they have on public perceptions of schools and teachers. If politicians and policymakers are amongst the audiences of the media reports, but never access the full story presented in the ACER reports, what conclusions are they drawing about the efficacy of Australian schools and teachers? How does this information feed into the current round of reviews being undertaken by the federal government – including the Quality Initial Teacher Education Review and the Review to Inform a Better and Fairer Education System? If the information is blatantly incorrect, as in The Australian’s story, is this record ever corrected?

The thematic treatment of the PIRLS results in the media echoes Nicole Mockler’s work on media portrayals of teachers. Mockler found portrayals of teachers in news media over the last 25 years were predominantly negative,continually calling into question the quality of the teaching profession as a whole. A similar theme is evident even for a casual observer of media reporting of standardised assessment results. 

Another problem is the proliferation of poor causal inferences about standardised assessment results on social media platforms – often from people who should know better. Newspapers use words like ‘failed’, ‘floundered’, ‘slipped’, and suddenly everyone wants to attribute causes to these phenomena without apparently questioning the accuracy of the reporting in the first place. The causes of increases or declines in population average scores on standardised assessments are complex and multifaceted. It’s unlikely that one specific intervention or alteration (even if it’s your favourite one) will cause substantial change at a population level, and gathering evidence to show that any educational intervention works is enormously difficult.

Notwithstanding the many good stories – the successes and the improvements that are evident in the data – my prediction is that next time there’s a standardised assessment to report on, news media will find the negative angle and run with it. Stay tuned for NAPLAN results 2023.

Sally Larsen is a Lecturer in Learning, Teaching and Inclusive Education at the University of New England. Her research is in the area of reading and maths development across the primary and early secondary school years in Australia, including investigating patterns of growth in NAPLAN assessment data. She is interested in educational measurement and quantitative methods in social and educational research. You can find her on Twitter @SallyLars_27

AARE 2022: That’s a wrap for a spectacular conference

It goes without saying that it’s been a difficult few years for in-person conferences. I’m sure many of us had high hopes for AARE 2022 and it certainly delivered spectacularly! From the excellent opening session on Monday morning, through all the presentations I was lucky enough to catch, to the opportunities to connect with colleagues old and new, I couldn’t fault anything (ok maybe too much cake at morning tea but a small price to pay for a lovely few days). As an early career researcher it was encouraging to see many just-graduated PhDs present their research, to audiences containing not only their supervisors, but also the many others who attended their presentations. The sense of community was certainly apparent.

It is challenging for ECRs to step into the realm of national research conferences. It takes a while to figure out whether you’re conferencing in the right way or not. AARE 2022 was the first in-person conference I’ve attended, having completed my entire PhD during COVID-19 lockdowns and travel restrictions. I’d heard about the generative nature of these events but I had to experience it first-hand to see how productive they can be. Everyone I met and talked with over the few days – no matter their role, position or length of time in the industry – was welcoming, encouraging and interested in the future of education research in Australia. If AARE 2022 is anything to go by, the future of our field is looking very strong.

My personal highlights included:

  • The welcome to country by Uncle Mickey: Thank you. We were so welcomed to Kaurna country and the theme of knowledge sharing permeated the days of the conference.
  • Professor Allyson Holbrook’s outgoing presidential address which prompted me to reflect on the uniqueness of a PhD undertaken in the field of education. We are rare indeed. Supporting the progress and career development of our current PhD students, and attracting more people with educational qualifications to pursue research will be an ongoing – but necessary – challenge.
  • The City West Campus of UniSA was a really spectacular location: I didn’t get lost even once! The weather was perfect and the outdoor spaces allowed many serendipitous meetings not possible in online conference format. Huge congratulations and thanks should go to all those who helped organise such an excellent event. 

Finally, the many individual talks interposed by themed symposiums are always the ultimate highlight of an in-person conference. In the following section I’ve drawn together some threads emerging from several different presentations that I observed during the 2022 AARE conference.

The missing link: Considering the agency of parents in the Australian educational landscape

I think it was Emma Rowe who had a beautiful metaphor about pulling the threads of seemingly different phenomena and watching how they unravelled (Day 2, Politics and Policy in Education symposium). In a similar vein I’d like to pull out some threads from multiple presentations in disparate streams and try to capture something missing. 

First the presentations: In the Day 3 Sociology of Education stream, Jung-sook Lee and Meghan Stacey from UNSW spoke about their work looking at perceptions of fairness in relation to educational inequities. The researchers presented a fictional scenario to a sample of almost 2000 Australian adults in which ‘students from high-income and low-income families have achievement gaps due to different quality of education provided to them’ (from the abstract). The scenario identified a situation where better-quality teachers for children from high-income families led to better educational outcomes for these children.

Interestingly people with children either currently in school or soon to attend school were less likely to perceive this scenario as unfair.

Prompted by the concluding questions proposed by the authors, audience discussion turned to the issue of why people – and parents in particular – might hold this oddly contradictory opinion. We pride ourselves in Australia (apparently) on being proudly egalitarian. The Gonski reviews (both the first and the second) were largely positively received in the Australian community. Yes! Of course children should have equitable access to educational resources. #IgiveaGonski. 

So why might the idea of educational equity not apply when considering the educational experiences of our own children? Why would it be ok, in the perceptions of the survey respondents, that some children get a better deal because their families have the capacity to pay for it?

The second presentation in the Schools and Education Systems stream (also Day 3) was that by Melissa Tham, Shuyan Huo and Andrew Wade from Victoria University. The study used data from the Longitudinal Study of Australian Youth (LSAY) and demonstrated that attendance at academically selective schools has apparently no long-term benefits for students attending these schools. The authors looked at a range of outcomes including university participation and completion, whether participants were employed, and life satisfaction at age 19 and again at age 25. None of these differed for students who had attended selective schools versus those who had not. 

The discussion again turned to the question of why parents are invested in sending their kids to academically selective schools if there’s no observable long-term benefit of doing so. [Of course, academically selective schools always top the rankings for the ATAR each year, but this is likely because the kids in these schools are already high-achievers, not because the selective schooling system adds value to their educational experience]. Indeed, there may be considerable medium-term disadvantages for some students in contexts where kids are grouped together in hothouses of ultra-competitiveness. 

A third paper that I wasn’t able to attend on Day 4 in the Social Justice stream touched again on the question of whether a private school education adds any value to educational outcomes (broadly defined). The authors Beatriz Gallo Cordoba, Venesser Fernandes, Simone McDonald and Maria Gindidis, looked at the way differences in Year 9 NAPLAN numeracy scores between public and private schools were related to funding inequities between these contexts, rather than school quality differences. While the abstract argued that ‘the increasing number of parents sending their children to private schools has been a growing trend causing controversy’, I am inclined to think that if equity is not the foremost consideration for parents in their school decision-making, then it’s not a controversy for them. Like all of us, parents want the best for children. It just so happens that they may make different decisions when it’s their own children (real and concrete as they are), rather than other people’s children (in the abstract).

Anecdotally, people are aware that there’s no academic benefit to these kinds of schools – neither the academically selective type nor the financially selective type. Earlier this year in The Conversation we summarized research showing no advantages to sending children to private schools when NAPLAN results are considered as an ‘outcome’. Apart from being roundly criticized once or twice for the apparently obvious findings, the thousands of comments we received on social media channels and on the website largely indicated that parents weren’t thinking of academics when they paid for a private education for their kids. But if not academics then what? And if we ostensibly believe in equity until it’s our kids in the mix then do we really believe it at all?  What is going on with parents’ decision-making that means these kinds of contradictory decisions are being made about their children’s schooling? 

This brings me (finally!) to my point: it felt like the missing thread drawing these disparate research papers together is the influence of parents. After all, which is the largest group of stakeholders in this game after teachers and children themselves? I think we downplay the influence of parents in the education of children at our peril. We can train teachers to be absolute superstars, we can lobby governments for more equitable funding allocations and better conditions for teachers, we can study cognitive development and how children learn in schooling contexts, we can work on inclusion, fairness and tolerance among students in school communities. But I wonder: if the influence of parents is not directly and explicitly confronted in research that examines educational inequities, policy or social justice (whether the influences are positive or negative), do we have a confounding variable problem? And if so, how can this be resolved?

No offence intended to the (possibly multiple) papers at AARE 2022 that did consider the role of parents in the education of their children. In particular among the presentations that I wasn’t able to catch on the final day was an intriguing one in a Politics and Policy symposium entitled ‘The construction of (good) parents (as professionals) in/through learning platforms’ presented by Sigrid Hartong and Jamie Manolev. Secondly, Anna Hogan presented her work in the Philanthropy in Education symposium, examining the changing role of Parents and Citizens (P&C) organisations in public schools. The findings of this work show how ‘parents are now operating as new philanthropists, solving the problem of inadequate state funding through private capital raising’ in public schools (from the abstract). I’m looking forward to papers for both of these studies in the near future! 

Postscript

These last few years have been challenging times for researchers in many fields, but maybe particularly so for education. Oftentimes it seems as though we move in totally different realms to the governments that make educational policy and the school sites which contain the teachers and students we are interested in supporting. The rise of research agencies external to universities (e.g. the Grattan Institute, the Centre for Independent Studies and AERO) or those subsumed within government departments (e.g. the Centre for Educational Statistics and Evaluation) may mean that our research work is sidelined or ignored, particularly when the findings are not immediately applicable or contradictory to national narratives of educational decline. 

AARE 2022 has reinforced to me the quality and depth of the research that is happening in universities across Australia in many diverse subfields of educational scholarship. I found out so much that I did not know before: and perhaps this in itself is a challenge for us. We know that our work is important and to whom it should apply. We can see the value in each other’s work when we attend conferences and allow the space to connect, discuss and imagine. How then do we ensure this value is recognised not only by the wider community, but also by all the teachers, early childhood educators, policymakers, parents and young people who are both the subjects and potential beneficiaries of our research?

Sally Larsen is a Lecturer in Learning, Teaching and Inclusive Education at the University of New England. Her research is in the area of reading and maths development across the primary and early secondary school years in Australia, including investigating patterns of growth in NAPLAN assessment data. She is interested in educational measurement and quantitative methods in social and educational research. You can find her on Twitter @SallyLars_27

The good, the bad and the pretty good actually

Every year headlines proclaim the imminent demise of the nation due to terrible, horrible, very bad NAPLAN results. But if we look at variability and results over time, it’s a bit of a different story.

I must admit, I’m thoroughly sick of NAPLAN reports. What I am most tired of, however, are moral panics about the disastrous state of Australian students’ school achievement that are often unsupported by the data.

A cursory glance at the headlines since NAPLAN 2022 results were released on Monday show several classics in the genre of “picking out something slightly negative to focus on so that the bigger picture is obscured”. 

A few examples (just for fun) include:

Reading standards for year 9 boys at record low, NAPLAN results show 

Written off: NAPLAN results expose where Queensland students are behind 

NAPLAN results show no overall decline in learning, but 2 per cent drop in participation levels an ‘issue of concern’ 

And my favourite (and a classic of the “yes, but” genre of tabloid reporting)

‘Mixed bag’ as Victorian students slip in numeracy, grammar and spelling in NAPLAN 

The latter contains the alarming news that “In Victoria, year 9 spelling slipped compared with last year from an average NAPLAN score of 579.7 to 576.7, but showed little change compared with 2008 (576.9). Year 5 grammar had a “substantial decrease” from average scores of 502.6 to 498.8.”

If you’re paying attention to the numbers, not just the hyperbole, you’ll notice that these ‘slips’ are in the order of 3 scale scores (Year 9 spelling) and 3.8 scale scores (Year 5 grammar). Perhaps the journalists are unaware that the NAPLAN scale ranges from 1-1000? It might be argued that a change in the mean of 3 scale scores is essentially what you get with normal fluctuations due to sampling variation – not, interestingly, a “substantial decrease”. 

The same might be said of the ‘record low’ reading scores for Year 9 boys. The alarm is caused by a 0.2 score difference between 2021 and 2022. When compared with the 2008 average for Year 9 boys the difference is 6 scale score points, but this difference is not noted in the 2022 NAPLAN Report as being ‘statistically significant’ – nor are many of the changes up or down in means or in percentages of students at or above the national minimum standard.

Even if differences are reported as statistically significant, it is important to note two things: 

1. Because we are ostensibly collecting data on the entire population, it’s arguable whether we should be using statistical significance at all.

2. As sample sizes increase, even very small differences can be “statistically significant” even if they are not practically meaningful.

Figure 1. NAPLAN Numeracy test mean scale scores for nine cohorts of students at Year 3, 5, 7 and 9.

The practical implications of reported differences in NAPLAN results from year to year (essentially the effect sizes) are not often canvassed in media reporting. This is an unfortunate omission and tends to enable narratives of largescale decline, particularly because the downward changes are trumpeted loudly while the positives are roundly ignored. 

The NAPLAN reports themselves do identify differences in terms of effect sizes – although the reasoning behind what magnitude delineates a ‘substantial difference’ in NAPLAN scale scores is not clearly explained. Nonetheless, moving the focus to a consideration of practical significance helps us ask: If an average score changes from year to year, or between groups, are the sizes of the differences something we should collectively be worried about? 

Interestingly, Australian students’ literacy and numeracy results have remained remarkably stable over the last 14 years. Figures 1 and 2 show the national mean scores for numeracy and reading for the nine cohorts of students who have completed the four NAPLAN years, starting in 2008 (notwithstanding the gap in 2020). There have been no precipitous declines, no stunning advances. Average scores tend to move around a little bit from year to year, but again, this may be due to sampling variability – we are, after all, comparing different groups of students. 

This is an important point for school leaders to remember too: even if schools track and interpret mean NAPLAN results each year, we would expect those mean scores to go up and down a little bit over each test occasion. The trick is to identify when an increase or decrease is more than what should be expected, given that we’re almost always comparing different groups of students (relatedly see Kraft, 2019 for an excellent discussion of interpreting effect sizes in education). 

Figure 2. NAPLAN Reading test mean scale scores for nine cohorts of students at Year 3, 5, 7 and 9.

Plotting the data in this way it seems evident to me that, since 2008, teachers have been doing their work of teaching, and students by-and-large have been progressing in their skills as they grow up, go to school and sit their tests in years 3, 5, 7 and 9. It’s actually a pretty good news story – notably not an ongoing and major disaster. 

Another way of looking at the data, and one that I think is much more interesting – and instructive – is to consider the variability in achievement between observed groups. This can help us see that just because one group has a lower average score than another group, this does not mean that all the students in the lower average group are doomed to failure.

Figure 3 shows just one example: the NAPLAN reading test scores of a random sample of 5000 Year 9 students who sat the test in NSW in 2018 (this subsample was randomly selected from data for the full cohort of students in that year, N=88,958). The red dots represent the mean score for boys (left) and girls (right). You can see that girls did better than boys on average. However, the distribution of scores is wide and almost completely overlaps (the grey dots for boys and the blue dots for girls). There are more boys at the very bottom of the distribution and a few more girls right at the top of the distribution, but these data don’t suggest to me that we should go into full panic mode that there’s a ‘huge literacy gap’ for Year 9 boys. We don’t currently have access to the raw data for 2022, but it’s unlikely that the distributions would look much different for the 2022 results.  

Figure 3. Individual scale scores and means for Reading for Year 9 boys and girls (NSW, 2018 data).

So what’s my point? Well, since NAPLAN testing is here to stay, I think we can do a lot better on at least two things: 1) reporting the data honestly (even when its not bad news), and 2) critiquing misleading or inaccurate reporting by pointing out errors of interpretation or overreach. These two aims require a level of analysis that goes beyond mean score comparisons to look more carefully at longitudinal trends (a key strength of the national assessment program) and variability across the distributions of achievement.

If you look at the data over time NAPLAN isn’t a story of a long, slow decline. In fact, it’s a story of stability and improvement. For example, I’m not sure that anyone has reported that the percentage of Indigenous students at or above the minimum standard for reading in Year 3 has stayed pretty stable since 2019 – at around 83% up from 68% in 2008. In Year 5 it’s the highest it’s ever been at 78.5% of Indigenous students at or above the minimum standard – up from 63% in 2008. 

Overall the 2022 NAPLAN report shows some slight declines, but also some improvements, and a lot that has remained pretty stable. 

As any teacher or school leader will tell you, improving students’ basic skills achievement is difficult, intensive and long-term work. Like any task worth undertaking, there will be victories and setbacks along the way. Any successes should not be overshadowed by the disaster narratives continually fostered by the 24/7 news cycle. At the same time, overinterpreting small average fluctuations doesn’t help either. Fostering a more nuanced and longer-term view when interpreting NAPLAN data, and recalling that it gives us a fairly one-dimensional view of student achievement and academic development would be a good place to start.

Sally Larsen is a Lecturer in Learning, Teaching and Inclusive Education at the University of New England. Her research is in the area of reading and maths development across the primary and early secondary school years in Australia, including investigating patterns of growth in NAPLAN assessment data. She is interested in educational measurement and quantitative methods in social and educational research. You can find her on Twitter @SallyLars_27

Everything you never knew you wanted to know about school funding

Book review: Waiting For Gonski: How Australia Failed its Schools, by Tom Greenwell and Chris Bonnor

With the 2022 federal election now in the rear-view mirror and a new Labor government taking office, discussions about the Education portfolio have already begun. As journalists and media commentators noted, education did not figure largely in the election campaign, notwithstanding the understandable public interest in this area. One of the enduring topics of education debates –  and the key theme of Waiting For Gonski: How Australia Failed its Schools, by Tom Greenwell and Chris Bonnor – is school funding.

It is easy, and common, to view the school funding debate as a partisan issue. Inequities in school funding are often presumed to be an extension of conservative government policies going back to the Howard government. Waiting for Gonski shows how inaccurate this perception is, and how far governments of any political persuasion have to go before true reform is achieved. 

The first part of the book is an analysis of the context that gave rise to the Review of Funding for Schooling in 2011, commonly known as the Gonski Report. Greenwell and Bonnor devote their first chapter to an overview of the policy arguments and reforms that consumed much of the 20th century, leading to the Gillard government establishing the review. This history is written in a compelling, detailed and interesting way, and contains many eye-opening revelations. For example, the parallels between the 1973 Karmel report and the 2011 Gonski version are somewhat demoralizing for those who feel that school funding reform should be attainable in our lifetimes. Secondly, the integral role that Catholic church authorities have played in the structure of funding distributions that continue to the present day is, I think, a piece of 20th century history that is very little known. Julia Gillard’s establishment of the first Gonski review is thus situated as part of a longer narrative that is as much a part of Australia’s cultural legacy as are questions around national holidays, or whether or not Australia should become a republic.

Several subsequent chapters detail the findings of the 2011 Gonski review, its reception by governments, lobby groups, and the public, and the immediate rush to build in exceptions when interest groups (particularly independent and catholic school bodies) saw they would “lose money”. The extent to which federal Labor governments are equally responsible for the inequitable state of school funding is made more and more apparent in the first half of the book. Greenwell and Bonnor sought far and wide for comments and recollections from many of the major players in this process, including politicians of both colours, commentators, lobbyists, and members of the review panel itself. This certainly shows in the rich detail and description of this section.

Rather than representing a true champion of equity and fairness, the Gonski report is painted as one built on flawed assumptions, burdened with legacies that were not properly unpacked, and marred by a multitude of compromises, designed to appease the loudest proponents of public funding for private and catholic schools. The second Gonski review, officially titled, Through Growth to Achievement: Report of The Review to Achieve Educational Excellence in Australian Schools, is given less emphasis perhaps because this second review was less about equity and funding and more about teacher quality and instructional reform – a book-length subject in itself.

Waiting for Gonski is most certainly an intriguing and entertaining read (a considerable achievement, given its fairly dry subject matter), and is highly relevant for those of us working towards educational improvements of any description in Australia. My main criticism of the book is that it tends to drag a little in the middle third. While the details of machinations between political leaders and catholic and independent school lobbyists are certainly interesting, the arguments in these middle chapters are generally repetitions from earlier chapters, with reiterated examples of specific funding inequities between schools. 

A second concern I have is the uncritical focus on Programme for International Student Assessment (PISA) data to support claims of widespread student academic failure. While it’s true that PISA shows long-term average declines in achievement amongst Australian school students, these assessments are not the only standardized tests of student achievement in this country. The National Assessment Program: Literacy and Numeracy (NAPLAN) is briefly touched upon in Chapter 8, but not emphasized. The reality is that while average student achievement on NAPLAN literacy and numeracy tests have not increased – after their initial boost between 2008 and 2009 – nor have students’ results suffered large scale declines. Figure 1 demonstrates this graphically, showing the mean scores for all cohorts who have completed four NAPLAN assessments (up until 2019).

Figure 1. Mean NAPLAN reading achievement for six cohorts in all Australian states and territories. Calendar years indicate Year 3. (Data sourced from the National Assessment Program: Results website) 

It seems somewhat disingenuous to focus so wholeheartedly on one standardized assessment regime at the expense of another to support claims that schools and students are ‘failing’. For example, in Chapter 3 the authors argue that,

 “…the second unlevel playing field [i.e. the uneven power of Australian schools to attract high performing students] is a major cause of negative peer effects and, therefore, the decline in the educational outcomes of young Australians witnessed over the course of the 21st century” (p.93) 

In my view, claims such as these are over-reach, not least because arguments of a decline in educational outcomes rely solely on PISA results. Furthermore, the notion that the scale and influence of peer effects are established facts is also not necessarily supported by the research literature. Other claims made about student achievement growth are similarly unsupported by longitudinal research. In this latter case, not because claims overinterpret existing research, rather because there is very little truly longitudinal research in Australia on patterns of basic skills development – despite the fact that NAPLAN is a tool capable of tracking achievement over time. 

Using hyperbole to reinforce a point is not a crime, of course, however the endless repetition of similar claims in the public sphere in Australia tends to reify ideas that are not always supported by empirical evidence. While these may simply be stylistic criticisms, they also throw into sharp relief the research gaps in the Australian context that could do with addressing from several angles (not just reports produced by the Australian Curriculum, Assessment and Reporting Authority [ACARA], which are liberally cited throughout).

I hope that the overabundance of detail, and the somewhat repetitive nature of the examples in this middle section of the book, don’t deter readers from the final chapter: Leveling the playing field. To the credit of Greenwell and Bonnor, rather than outline all the problems leaving readers with a sense of despair, the final chapter spells out several compelling policy options for future reform. While structures of education funding in Australia may seem intractable, the suggestions give concrete and seemingly-achievable options which would work presuming all players are equally interested in educational equity. The authors also tackle the issue of religious schools with sensitivity and candour. It is true that some parents want their children to attend religious schools. How policy can ensure that these schools don’t move further and further along the path of excluding the poorest and most disadvantaged – arguably those whom churches have the greatest mission to help – should be fully considered, without commentators tying themselves in knots over the fact that a proportion of Australia’s citizens have religious convictions.

Questions around school funding, school choice and educational outcomes are perennial topics in public debate in Australia. However, claims about funding reform should be underpinned by a good understanding of how the system actually works, and why it is like this in the first place. This is the great achievement of Greenwell and Bonnor in Waiting for Gonski. The way schools obtain government funding are obscure, to say the least, and there is a perception that private schools are not funded to the same extent as public schools. Waiting for Gonski clearly shows how wrong this idea is. As the book so powerfully argues, what Australia’s school funding system essentially does is allow children from already economically advantaged families to have access to additional educational resources via the school fee contributions these families are able to make. The book is a call to action to all of us to advocate for a rethink of the system.

Education is at the heart of public policy in many nations, not least in Australia. Waiting for Gonski is as much a cautionary tale for other nations as it is a comprehensive and insightful evaluation of what’s gone wrong in Australia, and how we might go about fixing it. 

Waiting for Gonski: How Australia Failed its Schools by Tom Greenwell & Chris Bonnor. 367pp. UNSW Press. RRP $39.99

Sally Larsen is a Lecturer in Learning, Teaching and Inclusive Education at the University of New England. Her research is in the area of reading and maths development across the primary and early secondary school years in Australia, including investigating patterns of growth in NAPLAN assessment data. She is interested in educational measurement and quantitative methods in social and educational research. You can find her on Twitter @SallyLars_27